Your business,
on autopilot.
One platform for creating, running and growing your business, powered by AI.
How to Share an AI Agent Dashboard With Your Team, Clients, or Investors




Last updated: September 2026. Every tool's sharing options were checked on its own help pages on September 29, 2026.
An AI agent can build you a good-looking dashboard in two minutes. The hard part is the link you send afterwards. Who can open it, whether the numbers are still true next Monday, and whether any of them came from a real source rather than the model's imagination: that is what decides whether a shared dashboard builds trust or quietly erodes it.
This guide shows how to share an AI agent dashboard safely. It is for business owners who want an agent to build a KPI dashboard or weekly report for a team, a client, or an investor, and for anyone who wants people to see what their agents have been doing. After the rules, it compares the common ways to do it: Google's Data Studio (formerly Looker Studio), Google Sheets, Notion, Claude and ChatGPT, and custom pages.
- Put five to eight numbers on it, not forty. Each one with its source, its date range, and when it was last refreshed
- Pick snapshot or live on purpose. A snapshot is safer to share; live data needs credentials and access control you can defend
- Match the link to the audience. Sign-in for your team, named people for investors, an unguessable link at most for clients, and a public link only for numbers you would post anyway
- Make the agent pull, never recall. Every figure should come from a query run that day, with the arithmetic done in code
- Refresh on a schedule, to the same URL, and send a short note on what changed rather than a new link every week
Quick Comparison
| Live or snapshot | Who can open the link | Link expiry | Scheduled refresh | |
|---|---|---|---|---|
| Data Studio (Looker Studio) | Live, cached 12 hours by default | Google sharing, or anyone with the link | Not documented for reports | Yes, PDF by email |
| Google Sheets | Live if formulas or connectors pull data | Specific people, or anyone with the link | Paid Google Workspace plans | Apps Script or add-ons |
| Notion | Whatever you or an integration writes | Workspace, guests, or public web link | Yes, on public links | Through integrations |
| Claude artifacts | Snapshot, or live via each viewer's own connectors | Claude account holders; link sharing on paid plans | Not documented; unaccepted invites lapse after 30 days | Not built in |
| ChatGPT shared links | Snapshot of the chat (personal accounts) | Anyone with the link | Not documented | Scheduled tasks exist; links do not update by themselves |
| Custom page your agent hosts | Your choice | Your choice | Your choice | Your agent's schedule |
Two Things People Mean by "AI Agent Dashboard"
The phrase covers two different jobs, and most people need both.
The first is a business dashboard the agent builds: revenue, orders, leads, traffic, ad spend, pulled from your tools and laid out on one page someone else can open. The agent is the analyst and the designer. The dashboard is the output.
The second is visibility into the agent itself: what it did this week, which tasks ran, what it drafted, what failed. Agencies share this with clients as proof of work; founders share it with a co-founder so nobody wonders what the AI is actually doing. Some agent products sell a read-only "public dashboard" for exactly this.
You rarely need two separate pages. The best shared dashboards put the numbers first and a short "what the agent did" block underneath: tasks completed, drafts waiting for approval, anything that failed. The numbers answer "how is the business doing," and the activity log answers "and what is being done about it."
What Belongs on a Shared AI Agent Dashboard
A shared dashboard is not your analytics page. Your analytics page answers any question you might have; a shared dashboard answers the three or four questions that particular reader always asks. Ask the agent to build for the reader, not for completeness.
A useful default for a small online business:
| Block | What it shows | Why it earns its place |
|---|---|---|
| Headline numbers | Revenue, orders, new leads, visitors for the period | The four figures everyone asks about first |
| Change vs last period | Each headline number against the previous equal period | A number without a comparison is trivia |
| One trend chart | Revenue or visitors by day for 30 to 90 days | Shows whether a bad week is a blip or a slope |
| Top sources | Where visitors and buyers came from | Tells the reader what is working |
| Agent activity | Tasks run, drafts waiting, failures | Proof of work, and early warning |
| Footer | Data sources, date range, "as of" timestamp | Lets anyone check a number themselves |
Leave out what the reader cannot act on. An investor does not need your top ten landing pages. A client does not need to see other clients, your margin on their account, or what your tools cost. And nobody outside the business should see customer names or order lists, which AI agents will happily include if the data is in front of them and nobody said not to.
Live Data or a Snapshot?
A snapshot is a page with the numbers written into it at build time. The agent queries your sources, computes the figures, and publishes a finished page. Nothing on the page can reach your systems, so there is no credential to leak and nothing for a viewer to poke at. The cost is freshness: the page is exactly as old as its last rebuild.
A live dashboard fetches data every time someone opens it. It is always current, which matters on a launch day, but the page now holds a connection to your data: anyone who can open it can see whatever that connection returns.
| Snapshot | Live | |
|---|---|---|
| Freshness | As of last rebuild | As of page load (or the tool's cache) |
| Risk if the link leaks | The numbers on the page | Whatever the data connection exposes |
| Needs credentials stored somewhere | No | Yes |
| Good for | Clients, investors, weekly reviews | Your own team, launch days, operations |
| Typical failure | Nobody rebuilt it, so it is stale | A connector broke, so it shows an error or zero |
"Live" is also less live than it sounds. Data Studio's default data freshness is 12 hours for most Google connectors, and partner connectors cannot go below that. A weekly snapshot that says "as of Monday 08:00" is often more honest than a "live" dashboard showing yesterday's cached data with no date on it.
For most small businesses the right answer is a snapshot rebuilt on a schedule for anyone outside the company, and live views for the people inside it.
Access Control: Public Links, Sign-In, and Expiry
There are four ways to control who opens a shared dashboard, from loosest to tightest:
- Public link, indexable. Anyone can open it, and search engines may find it. Only for numbers you would publish anyway
- Unlisted link. Anyone with the URL can open it, but it is not advertised. This is security by obscurity: links get forwarded, pasted into Slack, and saved in browser histories
- Sign-in required. The viewer must log in as someone you invited. Forwarding the link does nothing for the person it was forwarded to
- Sign-in plus named people. Only specific accounts, which you can revoke one by one
Expiry is the underused fifth control. Notion lets you set a public link to expire after a set time, and paid Google Workspace plans let you set an expiration date on someone's access to a Sheet. An investor update that stops opening after 30 days is a feature, not an inconvenience.
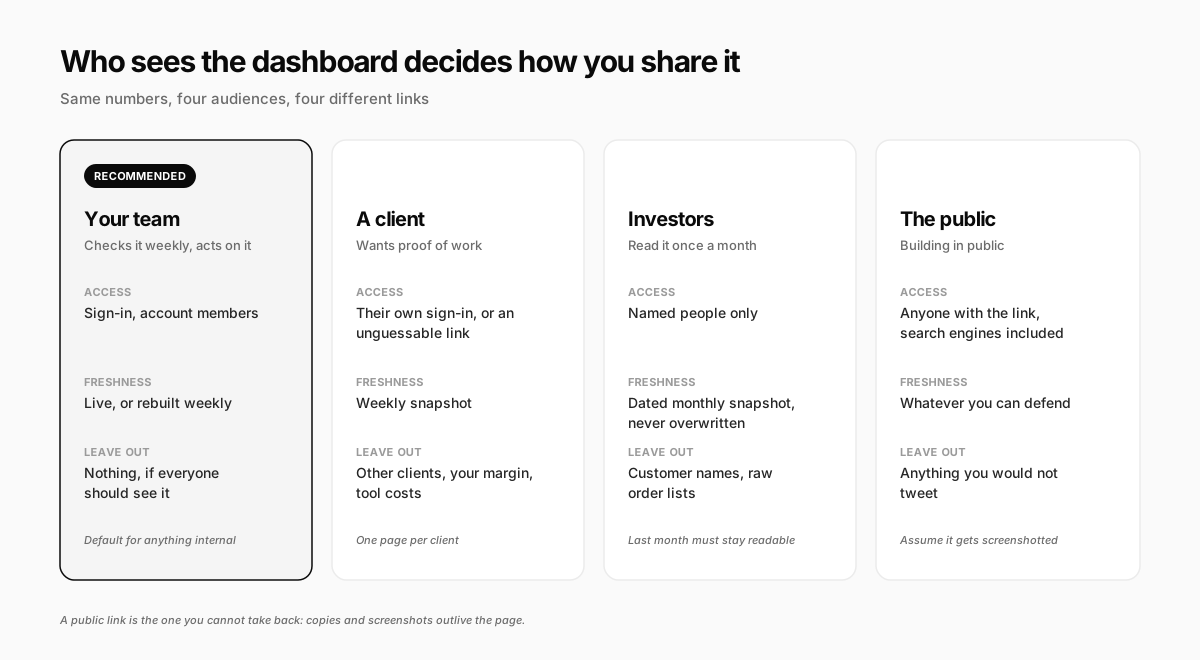
Two details catch people out. First, sign-in links do not unfurl. When you paste a gated link into Slack or an email, the preview is blank, because the unfurl bot cannot log in. Send a screenshot of the dashboard next to the link, or the link gets ignored. Second, a client or investor has to exist in whatever system does the sign-in. Sharing a gated page with an outside person usually means inviting them into your workspace as a guest or member, and that may give them more than one page. Check what else a guest can see before you invite one.
Keeping the Numbers Honest
This is where AI-built dashboards go wrong, and it is rarely dramatic. The agent does not lie on purpose. It fills a gap. If a connection fails, if the date range is ambiguous, or if last week's number is still sitting in the conversation, a language model will produce a plausible figure rather than an empty cell. Plausible and wrong is the worst possible dashboard number, because nobody checks it.
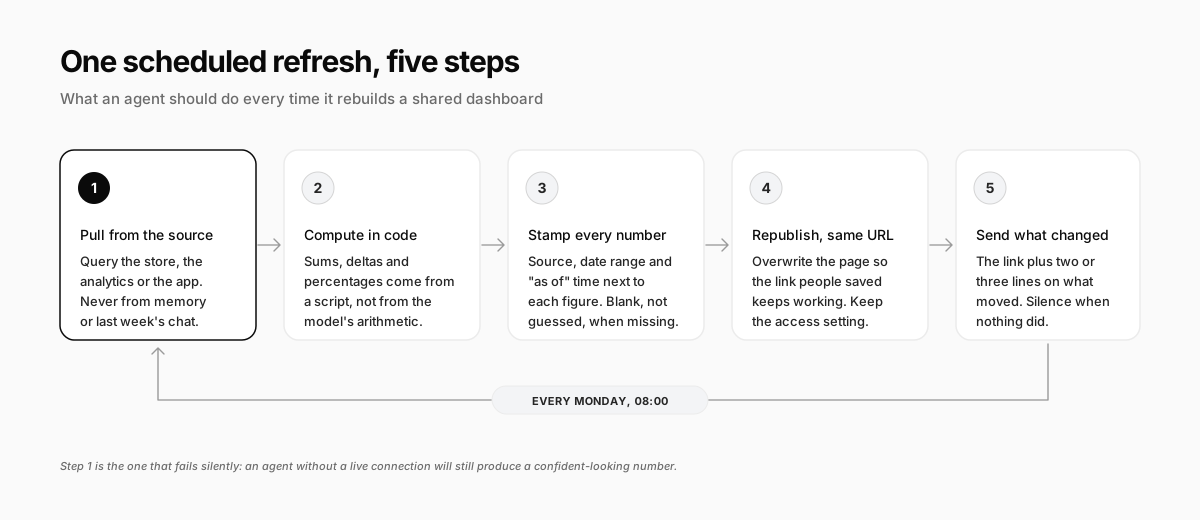
Rules that prevent it, written straight into the agent's instructions:
- Query every number fresh. "Pull last week's revenue from the store" beats "update the revenue figure." An agent told to update will sometimes edit the old number
- Do the math in code. Percent changes, sums, and averages should come from a script the agent runs, not from the model reading two numbers and writing a third
- Stamp every figure. Source, date range, and an "as of" time next to each number or in the footer. It makes errors findable
- Blank beats guessed. Tell the agent that a missing number is shown as "unavailable" with the reason, never estimated
- Check it once against the source. The first time, open the real revenue report next to the agent's page and compare. If three numbers match, the pipeline works; if one is off, fix the definition before anyone else sees it
- Define terms on the page. Does "revenue" include refunds? Tax? Does "lead" mean a form fill or an email signup? Write it in the footer
Numbers drift between tools for boring reasons: time zones, refund handling, test orders. If the dashboard says $15,480 and your payment processor says $15,120 for the same week, the reader will trust neither. The definitions line is what lets you explain the gap in one sentence.
Scheduled Refreshes That People Actually Read
A snapshot is only as good as its refresh. Set it up once as a recurring AI agent task, not a reminder to yourself.
- Pick the reader's cadence. Weekly for teams and clients, monthly for investors. Daily refreshes of a page nobody opens daily just burn AI credits
- Republish to the same URL. People bookmark the first link you send. A new link every week trains them to wait for your message instead of checking
- Archive where history matters. Investors want to compare this month with last month, so keep dated copies ("september-2026") next to the rolling page
- Send the change, not the page. The message that goes with the link should say what moved: "Revenue up 12%, two drafts need your approval, the ad sync failed Thursday." Three lines get read; "here's the dashboard" gets skipped
- Stay quiet when nothing changed. An agent told to say nothing on a flat week keeps the updates worth opening
Tools for Sharing an AI Agent Dashboard
Every option below can hold a dashboard an AI helped build. They differ in where the data lives, who can open the result, and what happens when the numbers change.
Data Studio (formerly Looker Studio)
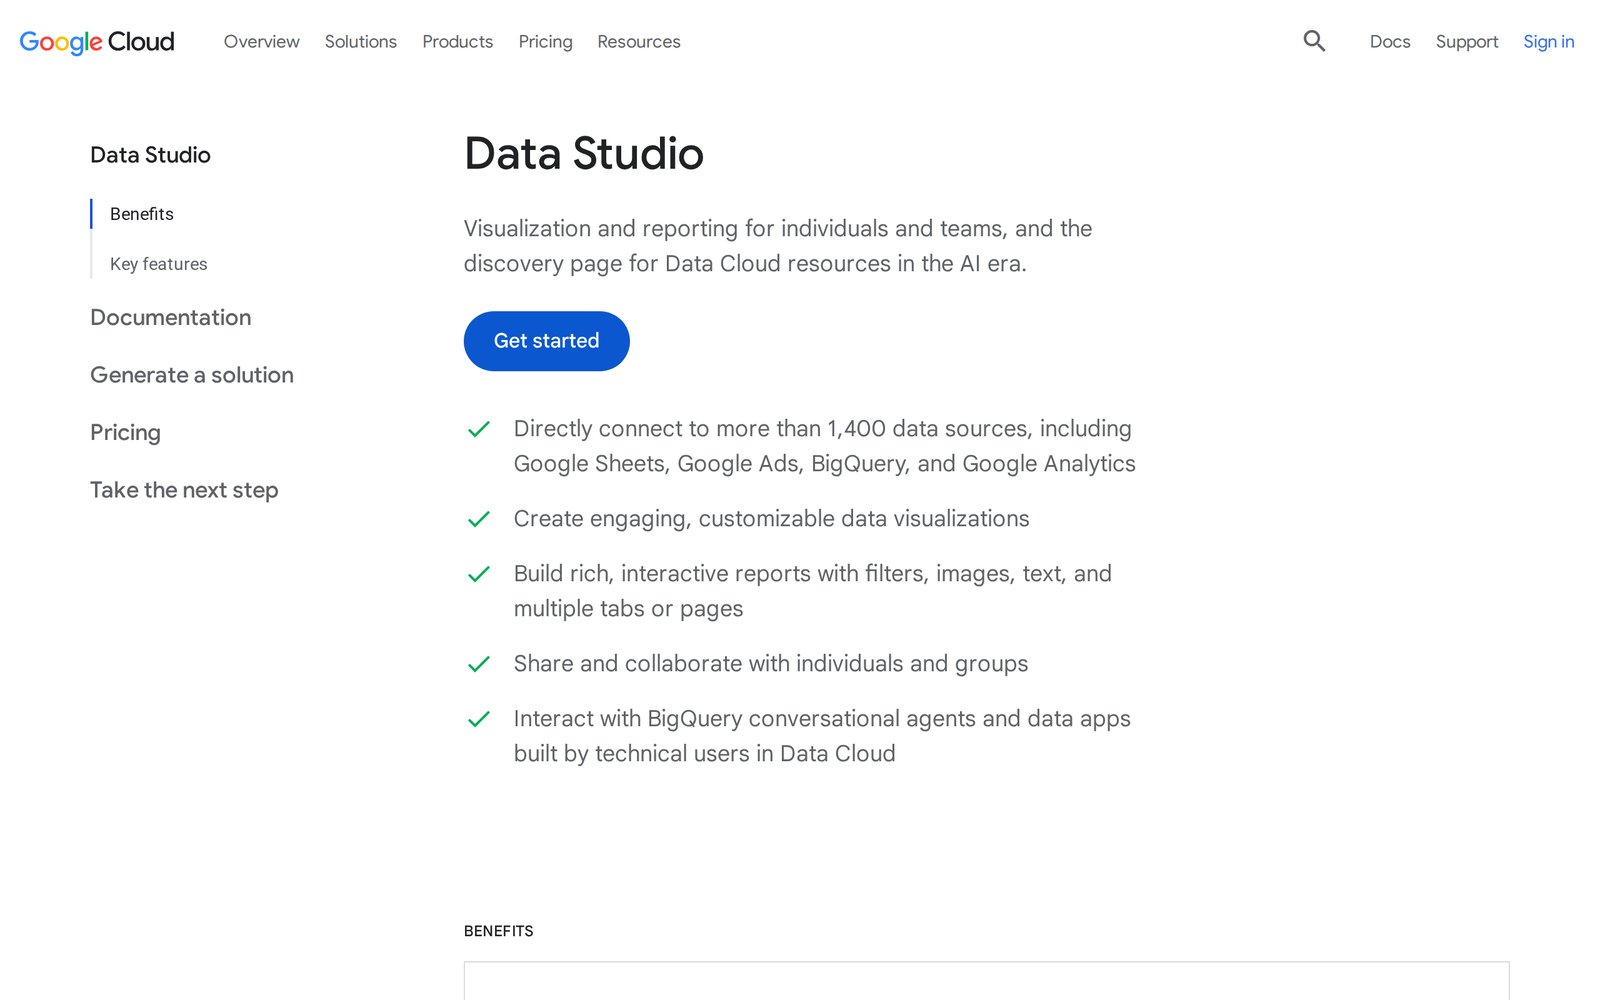
Google renamed Looker Studio back to Data Studio in April 2026; existing reports and links kept working. It is still the strongest free option for a classic live dashboard: it connects to Google Analytics, Google Ads, Sheets, BigQuery and many more sources, and you share a report the way you share a Google Doc, with specific people or anyone with the link. It can also email a PDF of the report on a schedule, which covers investors and clients who never open links.
The catch for AI agents: Data Studio is built for a person clicking together charts. An agent can write the data into a Sheet that Data Studio reads, but building and editing the report itself is still mostly manual. And the 12-hour default cache means "live" needs a date on it.
Google Sheets
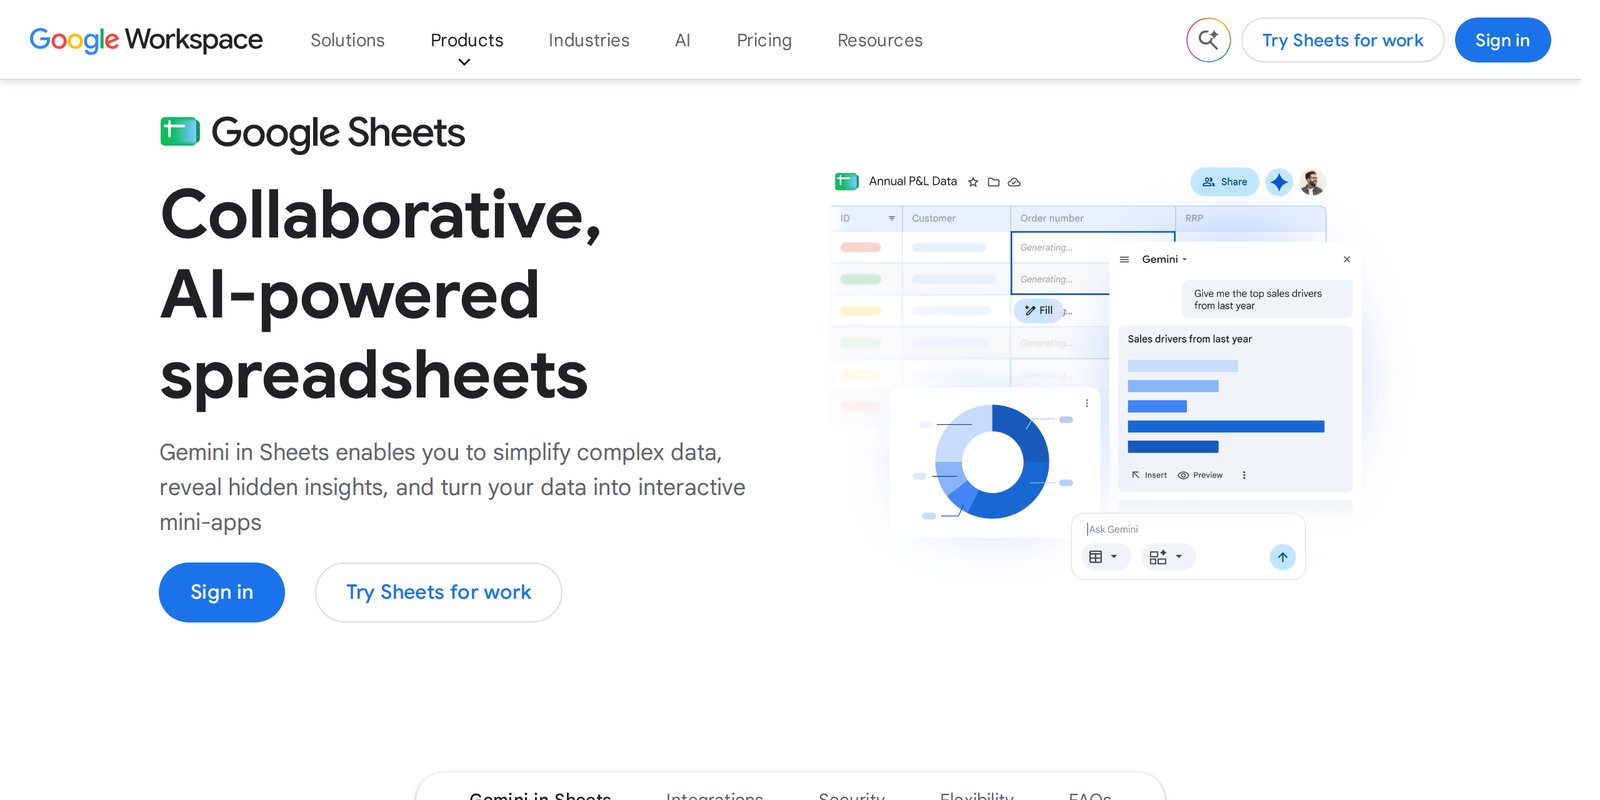
Sheets is the most common "dashboard" in small businesses, and for good reason: most AI agents can write to a Sheet through an integration, everyone knows how to open one, and sharing is familiar. It is the easiest way to let an agent append this week's numbers to a running table that a person or a Data Studio report turns into charts.
Its weakness is presentation and control. A Sheet shared with "anyone with the link" exposes every tab, including the raw one you forgot about. Keep the shared dashboard in its own file that pulls only summary figures from the working sheet, and use Workspace access expiry for outside readers.
Notion
Notion suits the "report with context" format: a few numbers, a chart from a database, and a written summary of what happened and what the agent is doing next. You can share with your workspace, invite outside guests (who need their own Notion account), or publish the page to the web with an optional link expiry.
The trade-off is that Notion holds whatever gets written into it. It does not query your store or your ad account by itself, so numbers arrive through an integration or an agent writing them in, and a Notion page is a snapshot unless something keeps updating it.
Claude and ChatGPT
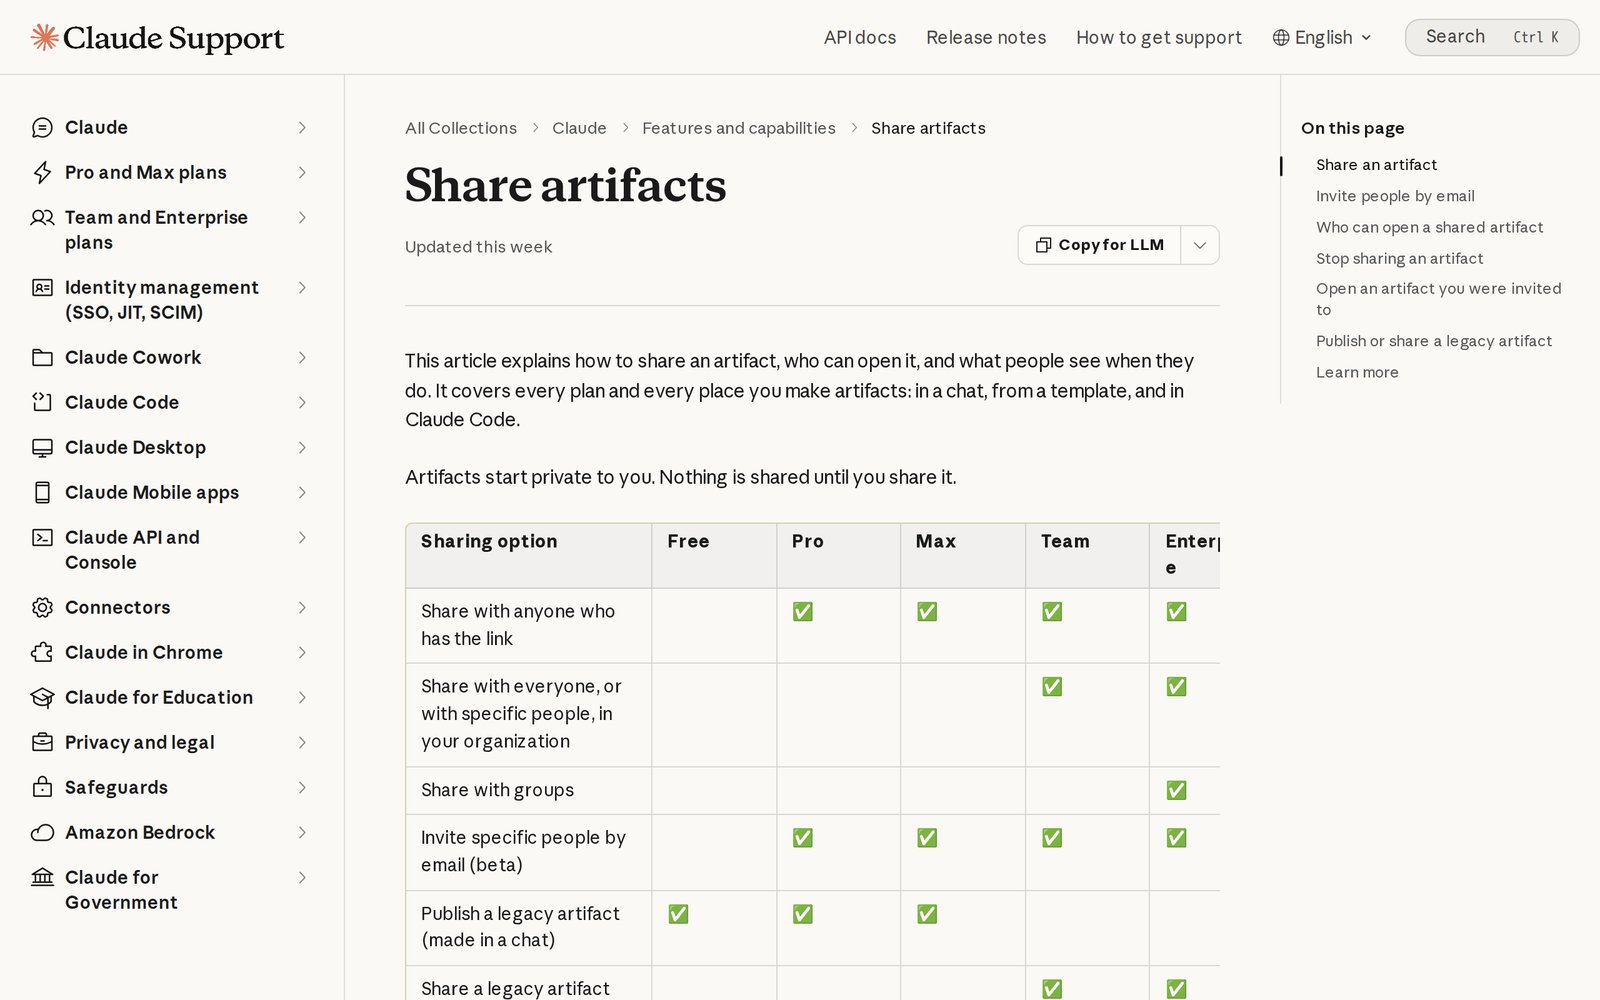
Both assistants turn pasted or connected data into a polished dashboard in one conversation, the fastest way to a first version.
Claude builds dashboards as artifacts, which start private. Pro and Max plans can share by link or invite people by email (in beta); Team and Enterprise keep artifacts inside the organization unless an owner allows outside sharing. Viewers need a Claude account, except for older artifacts published from a chat. One detail matters for honest numbers: an artifact that pulls from connected apps uses the viewer's connections, not yours, so a client who opens it sees an error where your data would be. For outside readers, a Claude dashboard is effectively a snapshot.
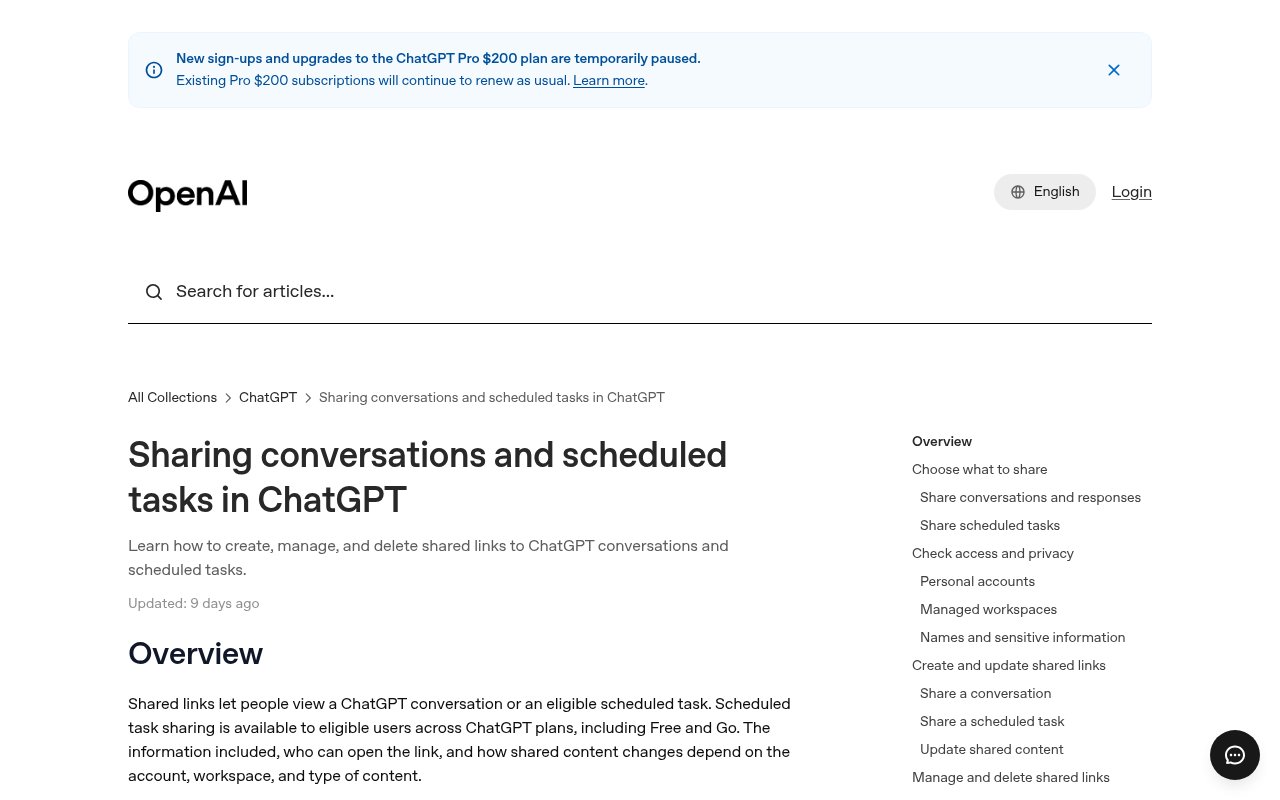
ChatGPT shares conversations rather than standalone pages. On personal accounts, a shared link is a snapshot of the chat at the moment you shared it, and you update it by hand; workspace links can include later messages. That works for "here is the analysis," less well for a dashboard someone bookmarks. ChatGPT can also share scheduled tasks, which is closer to "watch this report run" than to a dashboard.
Custom Pages Your Agent Hosts
The last option is to have the agent write the dashboard as a web page and host it somewhere with real access control. It is the most flexible: the layout fits the reader, the agent rebuilds it on a schedule, and access is set per page. The work moves from clicking charts to writing good instructions. So does the risk: nobody checks a custom page's numbers unless the instructions do.
How Crevio Builds and Shares Dashboards
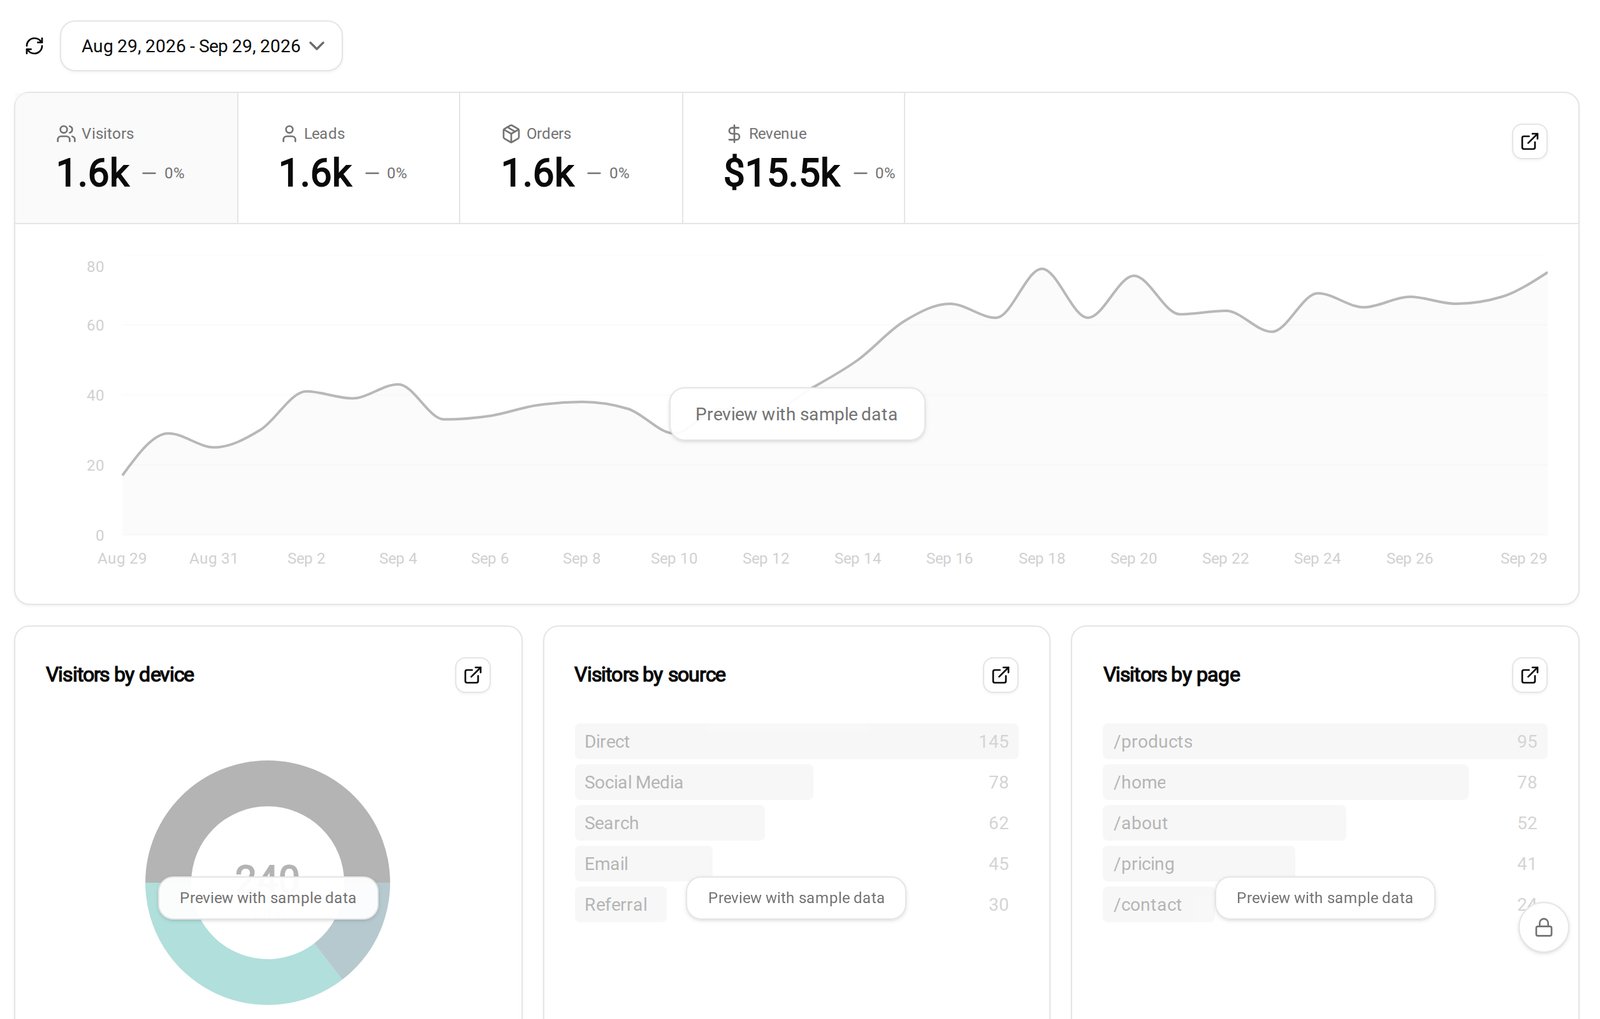
Crevio is an AI business builder: its agent already runs your store, products, customers, and website, plus the apps you connect. That puts it on the "custom pages your agent hosts" side, with the data source built in. The screenshot above is Crevio's own analytics page in preview mode, with sample data rather than a real business.
What it can do today:
- Read real numbers. The agent pulls a business overview (revenue, orders, leads, new customers, and site traffic, each compared with the previous period), per-site traffic, email metrics, and ad reports, plus data from connected apps
- Publish a dashboard as a hosted page. The agent writes a self-contained page and publishes it at a stable link. Republishing the same page replaces it at the same URL, so bookmarks keep working
- Control who opens it. Pages default to members of your Crevio account, who must sign in. You can narrow a page to specific people on your team (up to 50), and account admins always keep access. The agent is instructed to make a page public only when you ask for a public link. Someone signed in without access sees a "not found" page, which does not confirm the page exists
- Build a live version when you need one. Published pages are snapshots by design. For a dashboard that fetches data on every load, the agent builds a small site instead, and sites have their own access setting: public, customers, account members, admins only, or only you
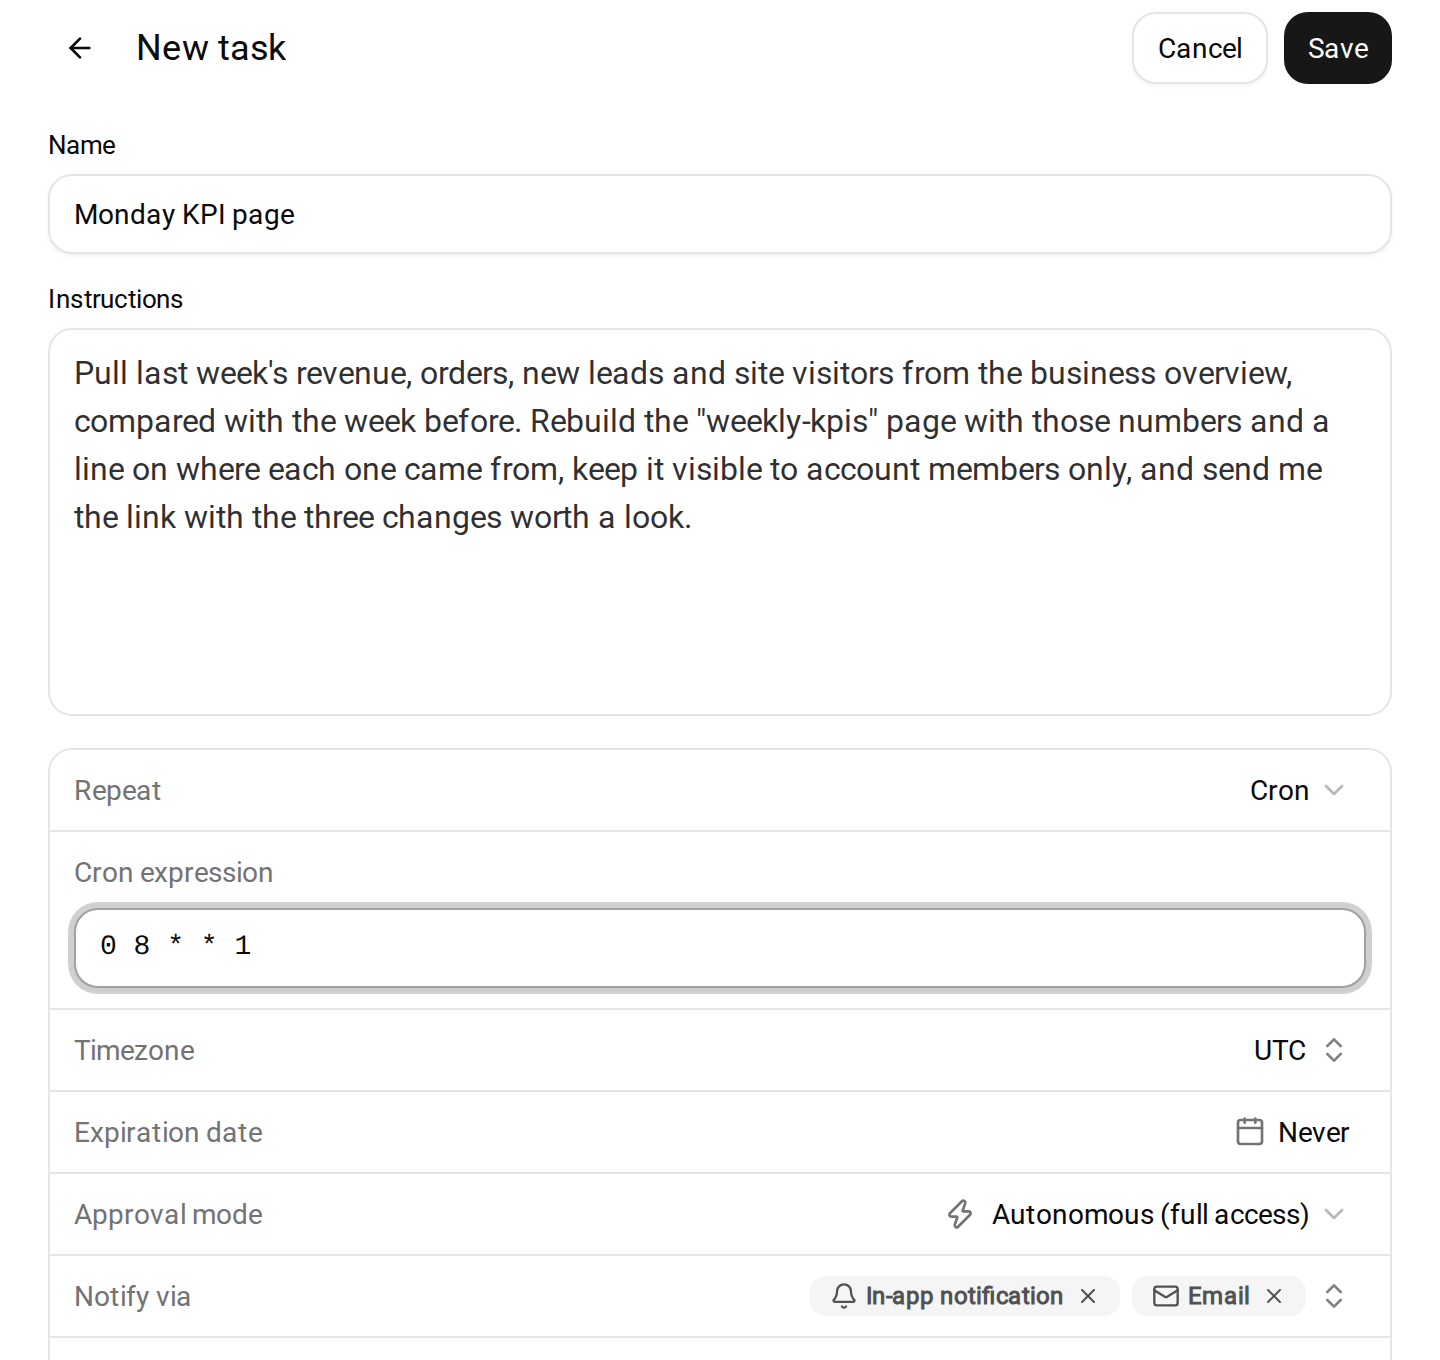
- Refresh on a schedule. A scheduled task can rebuild the page weekly and send the link with a summary by in-app notification and email by default, or by Slack, Telegram, or Discord once connected
Where it falls short, honestly:
- No link expiry. Pages stay up until you ask the agent to delete them or change who can open them
- Outside people need an account. Members-only and named-people pages work for people on your Crevio team. For a client or investor, the choices today are adding them to your team or using a public link
- Public pages are indexable. Crevio marks gated pages as not for search engines but leaves public ones open, so treat a public dashboard as published
- Honesty is instructions, not enforcement. Crevio gives the agent real data sources, but nothing checks that every figure on a page came from one. Put the "pull fresh, stamp every number, blank beats guessed" rules in the task, and compare the first version against the analytics page yourself
- Scheduled results go to one person. A task delivers to its owner (or back into the Slack conversation it was set up in), not to a list of recipients. For a team channel, ask the agent to post the link there through your connected Slack workspace
Each scheduled rebuild is an agent run that uses AI credits, and building a page is more work than writing a short digest. The free Starter plan's 20 credits a month is enough to try a dashboard, not to run one for months; Pro includes 1,000 and Business 2,500. Our guide to AI agent running costs breaks down what drives the cost of a run.
What Nobody Tells You
- The first shared number that turns out wrong costs more than the dashboard saved. Readers do not discount one bad figure; they discount the whole page, and every page after it. Check the first three versions by hand
- "Anyone with the link" is permanent in practice. You can revoke the page, but not the screenshot in a client's Slack or the PDF in an investor's inbox
- Clients read the activity log more than the numbers. "Published 4 posts, answered 31 support emails, 2 drafts waiting for you" builds more trust than a traffic chart they cannot interpret
- Dashboards drift from the business. The metrics you picked at launch stop mattering by month six. Review what is on the page every quarter, and ask the agent what it would remove
- Silence is a feature. An agent that sends "no meaningful change this week" three weeks running has trained everyone to ignore week four. Let it skip the message instead
Share AI Agent Dashboard FAQ
Can an AI agent build a dashboard from my business data?
Yes, if it has a live connection to your data: your store, analytics, ad accounts, or a spreadsheet it can read. Without one, it can only lay out numbers you paste in. Ask for a self-contained page or a Sheet, and require it to show each number's source and date range.
Is it safe to share a dashboard with a public link?
Only for numbers you would be comfortable posting publicly. Anyone with the URL can open it, links get forwarded, and some tools let search engines index public pages. For clients and investors, prefer sign-in, named people, or an expiring link, and keep customer names and order details out entirely.
How often should a shared AI dashboard refresh?
Match the reader's rhythm: weekly for teams and clients, monthly for investors, live only for people watching operations in real time. Republish to the same URL each time, keep dated copies where history matters, and send a two or three line summary of what changed.
The Short Version
A shared dashboard is a promise that the numbers are true and that only the right people can see them. Let the agent do the building and the weekly rebuild, but make it pull every figure fresh, stamp where each one came from, and pick the link as carefully as the charts. A number nobody can check is still a guess, however good the chart around it looks.
Related Blog Posts
What will you sell today?
Describe what you want to sell — Crevio builds, launches, and grows it. Products, payments, and marketing, all on autopilot.
Start for free