Your business,
on autopilot.
One platform for creating, running and growing your business, powered by AI.
Ecommerce Conversion Rate: 2026 Benchmarks and How to Improve It




The average ecommerce store converts somewhere between 2 and 3 out of every 100 visitors into a sale, and depending on which benchmark report you read, the "average" itself ranges anywhere from under 1.5% to nearly 4%. That spread isn't a typo. It's the reason store owners either panic over a conversion rate that's actually healthy, or shrug off one that's genuinely broken. This guide covers what a good ecommerce conversion rate actually looks like in 2026, how to calculate yours correctly, where most stores are quietly losing sales before checkout even starts, and which fixes move the number fastest.
- There's no single "good" conversion rate. It depends on device, average order value, and traffic source, and generic industry averages flatten all three into a number that's true for almost no one.
- Cart abandonment is the bigger lever, not traffic. Roughly 7 in 10 shoppers who add something to their cart leave without buying, and most of the documented reasons are fixable.
- Reviews are one of the cheapest, highest-leverage fixes. A handful of reviews can lift purchase likelihood by well over 100%, and the effect is strongest on higher-priced items.
- Speed compounds everything else. A 0.1-second improvement in mobile load time has been measured to lift retail conversion rates by 8.4%, on the same traffic, at the same cost.
What Counts as a Good Ecommerce Conversion Rate in 2026?
A Q2 2026 benchmark analysis of live Shopify stores puts the median store conversion rate at 2.07%, with a mean of 2.16% and the top quartile of stores converting at 2.59% or better. Those numbers already tell you something the single-average headline doesn't: half of all stores sit below 2%, and getting into the top 25% doesn't require some legendary conversion rate, just consistent execution.
Two variables move that number more than almost anything else: device and price point.
| Segment | Median conversion rate |
|---|---|
| Desktop | 3.74% |
| Mobile | 2.29% |
| Orders under $60 (AOV) | 2.42% |
| Orders $60 to $100 (AOV) | 2.01% |
| Orders $100 to $200 (AOV) | 1.58% |
| Orders over $200 (AOV) | 0.79% |
Desktop consistently outconverts mobile even though mobile carries the overwhelming majority of traffic (86% in the same dataset), and conversion rate falls almost in a straight line as average order value climbs. A $250 candle store and a $25 candle store are not competing for the same benchmark, and comparing yourself to the wrong one is a fast way to either celebrate a mediocre number or panic over a good one.
Conversion Rate by Industry
Category matters just as much as device or price. Shogun's H1 2026 benchmark report, based on live Shopify stores from January to June, puts the cross-industry median at 1.74% and shows a wide spread underneath it:
| Industry | Median conversion rate |
|---|---|
| Health & Wellness | 3.31% |
| Beauty & Personal Care | 3.16% |
| Food & Beverage | 2.99% |
| Toys & Hobbies | 2.09% |
| Apparel & Fashion | 1.69% |
| Consumer Electronics | 1.39% |
| Sports & Outdoors | 1.24% |
The pattern underneath the numbers: repeat-purchase, lower-consideration categories like beauty and food convert far higher than considered purchases like electronics or sporting goods, where shoppers research longer and compare more before buying. If you sell in a low-converting category by nature, the fix usually isn't "convert more like a skincare brand," it's shortening the research phase with better product information and reviews, not chasing a benchmark that doesn't apply to how your category gets bought.
Why "The Average Conversion Rate" Is a Trap
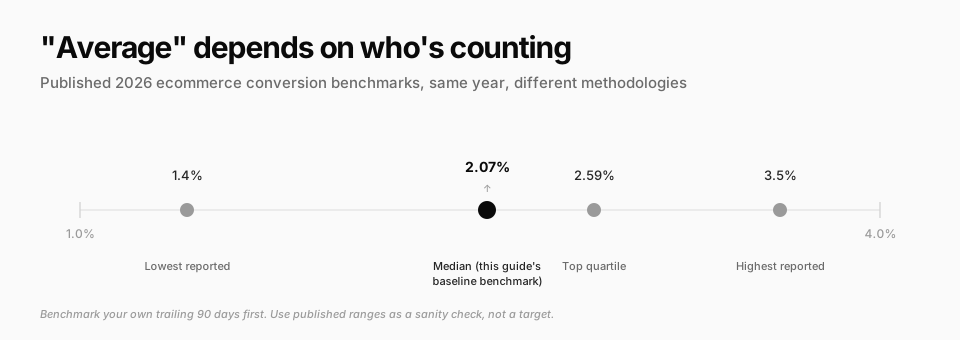
Search "average ecommerce conversion rate" and you'll find reputable-looking reports citing 1.4%, 1.6%, 1.89%, 2.5%, and 2.9%, sometimes all published in the same year. None of them are wrong exactly. They're measuring different things: some pool every Shopify store regardless of traffic quality, some only track paid-traffic sessions, some count a "session" differently, and some exclude stores below a revenue floor. The same 2026 benchmark report that produced the 2.07% median figure above says it plainly: a single global average "lacks context" and isn't useful on its own.
The practical takeaway: pick one benchmark source, apply it consistently, and segment by your own device mix and price point rather than chasing a headline number. Your most useful benchmark is usually your own store's trailing 90 days, not an industry report at all. Use published benchmarks to sanity-check whether you're in a normal range, not as a target to hit exactly.
How to Calculate Your Ecommerce Conversion Rate
The formula is simple, but the two most common ways store owners get it wrong are in the denominator.
Conversion rate = (Orders ÷ Sessions) × 100
Use sessions, not unique visitors: someone who visits three times before buying should count as three sessions in the denominator, not one visitor. Mixing the two makes your rate look artificially high.
Worked example: A store had 18,400 sessions and 390 completed orders last month.
390 ÷ 18,400 = 0.0212 → 2.12% conversion rate
That's roughly in line with the 2.07% median above, so this hypothetical store is performing normally, not badly, even though "only 2 out of 100 visitors buy" sounds alarming in isolation. Track this alongside two supporting numbers: add-to-cart rate (what share of visitors add anything to their cart at all, 5.95% is the current benchmark) and checkout completion rate (what share of started checkouts finish, roughly 48% in the same dataset). If your overall conversion rate is low but add-to-cart rate is normal, your problem is checkout, not your product pages, and that changes where you spend your next hour of effort.
Where Your Conversion Rate Actually Leaks
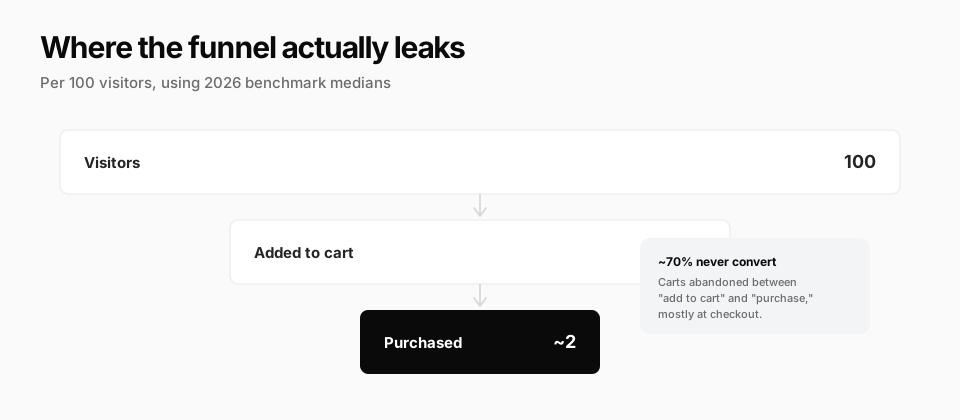
Baymard Institute's analysis of 50 separate cart abandonment studies puts the average documented cart abandonment rate at 70.22%. In plain terms: for every 10 shoppers who add something to their cart, roughly 7 leave without buying. That's a bigger lever than most stores treat it as, because it means the traffic and the product interest are already there. The problem is almost always somewhere between "add to cart" and "confirm payment," not upstream in marketing.
The Reasons Shoppers Actually Abandon Their Cart
Baymard's research breaks the top reasons down by how often shoppers report each one:
- Extra costs too high (shipping, tax, fees revealed too late): 40%
- Delivery was too slow: 20%
- Didn't trust the site with card information: 19%
- Forced to create an account: 18%
- Checkout was too long or complicated: 17%
Notice what's not on that list: price of the product itself, or a lack of interest in buying. Every reason above is a checkout design decision, not a demand problem, which is exactly why fixing checkout usually beats trying to drive more traffic to the same leaky funnel.
9 Ways to Improve Your Ecommerce Conversion Rate
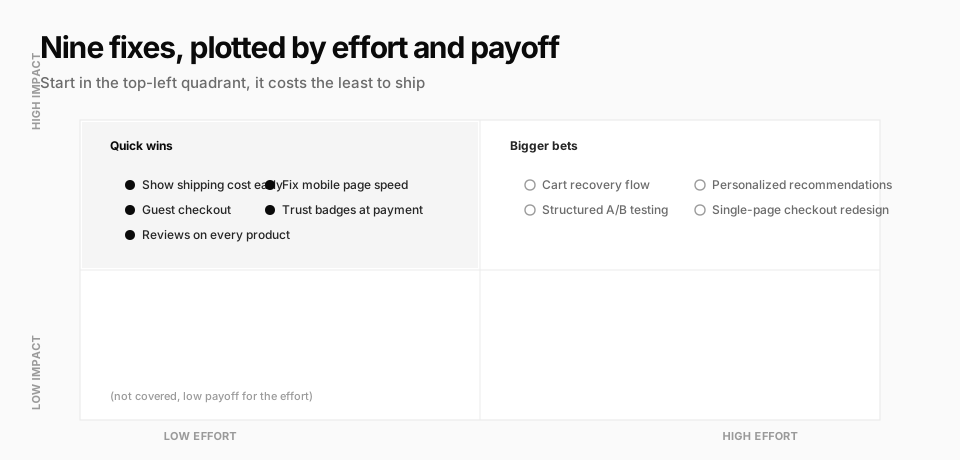
Not every fix deserves the same amount of engineering time. These nine are grouped by what they actually cost you to ship versus what they're worth. Several of them overlap with the site-level fundamentals in our breakdown of 10 best ecommerce websites and why they convert. The focus here is narrower: the specific number each decision moves, not just whether the site looks good.
Quick wins (low effort, high impact)
- Show shipping cost and total before the final checkout step. This directly addresses the single biggest abandonment reason above. A shipping calculator on the cart page, before checkout even starts, removes the surprise.
- Turn on guest checkout. Forced account creation is cited by nearly 1 in 5 abandoning shoppers. Let people buy first and create an account afterward if they want to.
- Add reviews to every product page, not just bestsellers. The Spiegel Research Center at Northwestern's Medill School found that a product with five reviews sees 270% greater purchase likelihood than an identical product with zero, and the effect is even stronger, 380%, on higher-priced items where the buyer is taking on more risk.
- Fix mobile page speed first. Mobile carries most ecommerce traffic but converts worse, and speed is a big part of why. Google and Deloitte's analysis of 30 million retail sessions found that a 0.1-second improvement in mobile load time lifted retail conversion rates by 8.4%, on the same traffic.
- Add trust signals near the payment field, not just in the footer. Security badges, accepted payment logos, and a visible return policy link address the "didn't trust the site with card info" objection at the exact moment it's strongest.
Bigger bets (higher effort, high impact)
- Build a real cart abandonment recovery flow. An automated email or SMS sequence to shoppers who added items but didn't buy recovers sales that quick fixes alone won't.
- Run a structured A/B testing program, not one-off changes. Quick wins can show results in 2 to 4 weeks, but a proper testing program takes 2 to 3 months to produce statistically significant results, and it compounds over time.
- Personalize product recommendations and search results. Static "you might also like" widgets convert worse than recommendations that reflect what a specific shopper has actually browsed or bought.
- Redesign checkout as a single, linear flow. If your checkout currently spans four or five separate pages, consolidating it into one scrollable step removes clicks and cuts the points where someone can get distracted and leave.
Tools to Track and Improve Your Conversion Rate
| Tool | Best for | Cost |
|---|---|---|
| Google Analytics 4 | Session tracking, funnel reports, free | Free |
| Hotjar | Heatmaps and session recordings to see where people hesitate | Free tier, paid plans scale with traffic |
| Built-in checkout analytics (e.g. Crevio) | Digital product sellers who want conversion data without a separate analytics stack | Included in plan |
GA4 and Hotjar answer different questions: GA4 tells you where in the funnel people drop off; Hotjar shows you why, by letting you watch what actually happened on the page. Most stores need both, at least until the store is mature enough to justify a dedicated CRO tool or agency. If you sell digital products specifically, our conversion playbook for digital product sales goes deeper into funnel-specific tactics like urgency, bundling, and win-back offers that sit outside the scope of this guide.
Where Crevio Fits (and Where It Doesn't)
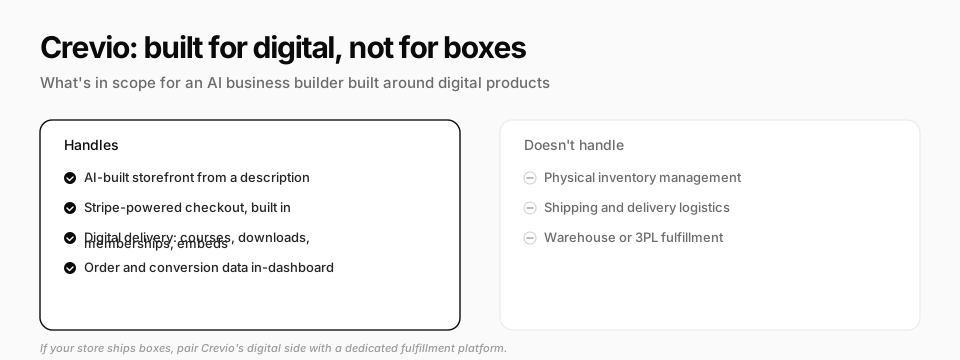
Most of this guide applies to any ecommerce store, physical or digital. Crevio is built specifically for the digital side: courses, downloads, memberships, and embeds, where there's no warehouse, no shipping estimate, and no delivery-speed objection to worry about. You describe what you're selling and Crevio's AI builds the storefront and sets up a Stripe-powered checkout, with conversion and order data visible in the dashboard from day one instead of requiring a separate analytics install.
Being honest about scope matters here: Crevio doesn't handle physical inventory, shipping, or fulfillment, so if your store ships boxes, a platform built around fulfillment logistics is the right tool, not an AI business builder. For a digital product business specifically, several of the fixes above are already handled by default: guest checkout, upfront pricing with no surprise shipping fees, and a single-page Stripe checkout instead of a multi-step flow. Crevio's Starter plan is free with a 5% transaction fee, Pro is $20/month at 2.5%, and Business is $50/month at 1%, so testing whether a cleaner checkout moves your number doesn't require a big upfront commitment. If digital products are only part of what you sell, our guide on essential tools for digital product creators covers how to combine that side with a separate physical-fulfillment platform.
The Bottom Line
A conversion rate benchmark is a sanity check, not a scoreboard. The store owners who move their number aren't the ones chasing a generic "3% is good" headline, they're the ones who know their own device split, their own price point, and where in their specific funnel the 70% of abandoning shoppers are actually leaving. Fix the checkout friction Baymard's research already told you about before you spend another dollar on traffic to send into the same leak.
FAQ
There's no single number that applies to every store, but a 2026 benchmark of live Shopify stores puts the median at 2.07%, with the top 25% of stores converting at 2.59% or better. Desktop stores and lower-priced products tend to convert higher than mobile-heavy or higher-priced stores, so compare yourself against a segment close to your own, not the flat industry average.
The most common cause isn't traffic quality. It's checkout friction. Baymard Institute's research across 50 studies found the top reported reasons shoppers abandon a cart are surprise costs revealed late (40%), slow delivery estimates (20%), distrust with payment information (19%), and forced account creation (18%). Check your funnel to see whether people are dropping at add-to-cart or at checkout: those two problems have very different fixes.
Around 2.29% is the current benchmark median for mobile, compared with 3.74% on desktop, even though mobile now accounts for roughly 86% of ecommerce sessions. The gap is mostly checkout friction, not interest: a form-heavy, multi-page checkout is far more annoying to complete on a small screen, so the fixes that close the gap fastest are guest checkout, autofill-friendly payment fields, and cutting checkout down to as few screens as possible.
Related Blog Posts
- 10 Best Ecommerce Websites in 2026 (And Why They Convert)
- Ecommerce Payment Processing: How It Works and What It Costs in 2026
- How to Maximize Digital Product Sales: A Conversion Playbook
- 12 Best Ecommerce Business Ideas to Start in 2026 (With Real Startup Costs)
- 7 Essential Tools for Digital Product Creators in 2025
What will you sell today?
Describe what you want to sell — Crevio builds, launches, and grows it. Products, payments, and marketing, all on autopilot.
Start for free